Best UPSC and MPPSC IAS Coaching Classes in Gwalior

Ganga Rejuvenation: Projects, Standards, and Basin Strategy

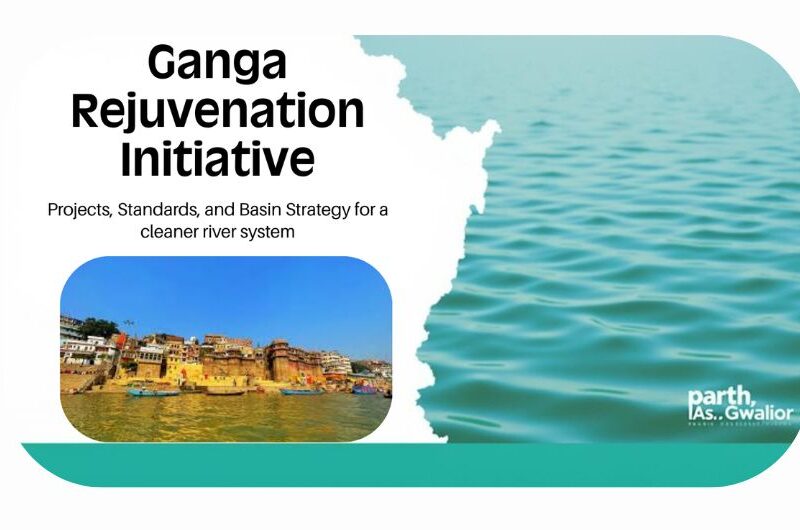
Ganga Rejuvenation: Projects, Standards, and Basin Strategy     1. Namami Gange began in June 2014 as an integrated mission for pollution abatement, conservation, and rejuvenation of National River Ganga. 2. The programme originally had ₹20,000 crore outlay up to March 2021, later extended to March 2026 with ₹22,500 crore. 3. For 2025–26, the National Ganga Plan has an outlay of ₹3,400 crore to expand treatment and improve water quality. 4. The stated aim includes achieving prescribed bathing standards through stronger sewage treatment and industrial discharge regulation by 2025. 5. The Ganga basin is India’s largest, covering about 27% land area and supporting nearly 47% of the population. 6. The basin spans more than 11 states, with around 65.57% land under agriculture and 3.47% under water bodies. 7. Despite high precipitation share, the basin remains highly water-stressed, reflecting low per-capita rainwater availability. 8. Rejuvenation vision emphasizes Aviral Dhara, Nirmal Dhara, and protection of geological and ecological integrity. 9. Basin management planning follows an integrated river-basin approach with multi-sectoral and multi-agency interventions. 10. Four intervention pillars include pollution abatement, ecological flow improvement, people–river connect, and research-policy support. 11. By 31 January 2025, 492 projects worth ₹40,121.48 crore had been initiated under the mission framework. 12. Of these, 307 projects were completed and operational, indicating substantial progress across multiple intervention areas. 13. Sewage infrastructure remains central: 206 projects were initiated with ₹33,003.63 crore sanctioned for implementation. 14. Sewerage outcomes include 127 completed projects that directly reduce untreated sewage inflows into the river system. 15. Biodiversity and afforestation actions include 56 projects with over ₹905.62 crore committed, and 39 already completed.     MCQ   1. With reference to the Namami Gange programme, consider the following statements: 1. It was approved as an integrated conservation mission in June 2014. 2. It was approved as a flagship programme by the Union Government. 3. Its twin objectives include pollution abatement and rejuvenation of the Ganga. Which of the statements given above is/are correct? (a) 1 and 2 only (b) 2 and 3 only (c) 1 and 3 only (d) 1, 2 and 3 2. The extended budgetary outlay of the Namami Gange Programme up to March 2026 is: (a) ₹20,000 crore (b) ₹22,500 crore (c) ₹3,400 crore (d) ₹40,121.48 crore 3. The financial outlay mentioned for the National Ganga Plan for the year 2025–26 is: (a) ₹905.62 crore (b) ₹3,400 crore (c) ₹22,500 crore (d) ₹33,003.63 crore 4. The Ganga River Basin is described as: (a) Covering about 47% of India’s land mass and supporting 27% population (b) Covering about 27% of India’s land mass and supporting about 47% population (c) Covering about 11% of India’s land mass and supporting about 65.57% population (d) Covering about 27% of India’s land mass and supporting about 27% population 5. As per the given description, the majority share of the Ganga basin land-use is under: (a) Water bodies (b) Agriculture (c) Forests (d) Urban settlements 6. The trio of terms most directly linked to the stated vision of Ganga rejuvenation is: (a) Jal Shakti, Swachhata, Sanitation (b) Aviral Dhara, Nirmal Dhara, Ecological integrity (c) Carbon neutrality, Circularity, Climate resilience (d) Flood control, Inland navigation, Hydropower 7. The Ganga River Basin Management Plan (GRBMP) is stated to be developed by: (a) A consortium of seven IITs (b) A consortium of seven IIMs (c) A consortium of seven Central Universities (d) A consortium of seven national laboratories 8. Match the following intervention pillars: List-I A. Nirmal Ganga B. Aviral Ganga C. Jan Ganga D. Gyan Ganga List-II 1. Pollution abatement 2. Improving ecology and flow 3. People–river connect 4. Research and policy support Select the correct answer using the code given below: (a) A-2, B-1, C-3, D-4 (b) A-1, B-2, C-3, D-4 (c) A-1, B-3, C-2, D-4 (d) A-3, B-2, C-1, D-4 9. As of 31 January 2025, the total number of projects launched and their value were: (a) 307 projects worth ₹40,121.48 crore (b) 492 projects worth ₹40,121.48 crore (c) 492 projects worth ₹33,003.63 crore (d) 206 projects worth ₹40,121.48 crore 10. As of 31 January 2025, the number of completed and operational projects was: (a) 127 (b) 206 (c) 307 (d) 492 11. Consider the following statements: 1. Sewage infrastructure projects initiated were 206 in number. 2. Funds sanctioned for sewage infrastructure projects were ₹33,003.63 crore. 3. Completed sewerage projects were 127 in number. Which of the statements given above is/are correct? (a) 1 only (b) 1 and 2 only (c) 2 and 3 only (d) 1, 2 and 3 12. The recently approved project in Varanasi included interception and diversion of the Durga Drain and construction of a sewage treatment plant of: (a) 17 MLD (b) 60 MLD (c) 75 MLD (d) 127 MLD 13. The Varanasi project mentioned is stated to be based on: (a) DBOT model (b) EPC model (c) Hybrid annuity model (d) TOT model 14. The approved initiative to prevent untreated sewage from entering Varuna in Bhadohi includes STPs of capacities: (a) 60, 17 and 5 MLD (b) 20, 6.25 and 4.5 MLD (c) 17, 5 and 3 MLD (d) 75, 60 and 3 MLD 15. With reference to biodiversity and afforestation under the programme, consider the following statements: 1. 56 projects were undertaken with funding commitment over ₹905.62 crore. 2. 39 such projects have been successfully concluded. Which of the statements given above is/are correct? (a) 1 only (b) 2 only (c) Both 1 and 2 (d) Neither 1 nor 2        

More Details

Intensity-Based Carbon Market Framework

Intensity-Based Carbon Market Framework     1. Carbon Market Buildout: India is developing a regulated carbon pricing ecosystem, combining a rate-based emissions trading system with voluntary crediting to support decarbonisation and climate-aligned growth. 2. Rate-Based ETS Concept: In a rate-based ETS, entities face benchmark emissions-intensity limits rather than absolute caps, allowing flexibility for growth while still rewarding improved efficiency and competitiveness. 3. CCTS Foundation: The Carbon Credit Trading Scheme, notified in July 2024, established the institutional framework for the Indian Carbon Market and links compliance obligations with voluntary offset participation. 4. Initial Sector Coverage: The national ETS is planned to begin with nine energy-intensive industrial sectors, focusing on emissions intensity metrics to drive performance improvements across major emitting value chains. 5. Credit Certificate Logic: Facilities outperforming benchmark emissions-intensity levels will receive credit certificates, creating an incentive structure where efficiency leaders can monetise surplus performance through market mechanisms. 6. Voluntary Methodologies: On 28 March 2025, the Ministry of Power approved eight crediting methodologies enabling voluntary carbon credits, including renewable energy, green hydrogen production, industrial efficiency, and mangrove restoration. 7. PAT Transition Path: India plans a gradual transition during 2025 from the Perform, Achieve and Trade scheme toward the new carbon market architecture, aligning efficiency trading with broader carbon pricing goals. 8. Legal Enabling Framework: The Energy Conservation (Amendment) Act, 2022 provides legal basis for carbon markets and empowers the central government to issue carbon credit certificates for compliant and credited entities. 9. Green Hydrogen Linkage: Carbon market methodologies support the National Green Hydrogen Mission, which targets production of five million metric tonnes annually by 2030, strengthening low-carbon industrial competitiveness. 10. PAT Performance Record: PAT, implemented by the Bureau of Energy Efficiency since 2012, is reported to have reduced emissions intensity in designated sectors by roughly fifteen to twenty-five percent. 11. Renewables Capacity Goal: India aims to install five hundred gigawatts of non-fossil fuel-based capacity by 2030, reinforcing carbon market signals with large-scale clean power expansion. 12. Governance Architecture: Market oversight includes the National Steering Committee for the Indian Carbon Market and the Bureau of Energy Efficiency under the Ministry of Power, supported by rules, procedures, and working groups. 13. Mission LiFE Agenda: Mission LiFE promotes sustainable lifestyles through behavioural change, aiming to mobilise one billion people globally by 2028 and mainstream pro-planet habits across communities and markets. 14. Green Credit Rules: Green Credit Rules notified on 12 October 2023 create a voluntary market mechanism for tree plantation on degraded forest lands, issuing credits via a digital registry with verification and audits. 15. Competitiveness and CBAM: As external pressures like carbon border measures grow, India’s intensity-based ETS offers a pragmatic path to preserve export competitiveness while advancing climate goals and net-zero by 2070.       MCQ:   1. With reference to a rate-based Emissions Trading System (ETS), consider the following statements: 1. Total national emissions are capped ex ante. 2. Entities are assessed against benchmark emissions-intensity levels. 3. It offers flexibility under uncertain growth conditions. Which of the statements given above is/are correct? A. 1 and 2 only B. 2 and 3 only C. 1 and 3 only D. 1, 2 and 3 2. India’s carbon pricing framework described here is best characterized by: A. Cap-and-trade with absolute sectoral caps from inception B. Intensity-focused trading with both compliance and voluntary elements C. Purely voluntary offsets without institutional backing D. Carbon tax with uniform rate across all fuels 3. Consider the following statements about the Carbon Credit Trading Scheme (CCTS): 1. It was adopted in July 2024. 2. It established an institutional framework for a domestic carbon market. 3. It contains a compliance mechanism and an offset mechanism. Which of the statements given above is/are correct? A. 1 and 2 only B. 2 and 3 only C. 1 and 3 only D. 1, 2 and 3 4. The credit certificates under the described system are issued primarily to: A. Entities that exceed benchmark emissions-intensity levels B. Facilities that outperform benchmark emissions-intensity levels C. Only renewable-energy generators, irrespective of benchmarks D. All obligated entities in equal quantities each year 5. The national ETS at the initial stage is stated to cover: A. Nine energy-intensive industrial sectors B. All sectors except agriculture C. Only the power sector D. Only transport and buildings 6. On 28 March 2025, approval was given for crediting methodologies intended for: A. Mandatory compliance credits only B. Voluntary carbon credit generation C. A carbon tax rate schedule D. Fossil-fuel subsidy rationalisation 7. Which of the following is included among the approved voluntary crediting areas mentioned? A. Nuclear power uprating B. Green hydrogen production C. Metro rail expansion D. Coal washing mandates 8. The planned shift in 2025 indicates a transition from which earlier market-based programme toward the new architecture? A. UDAY B. UJALA C. Perform, Achieve and Trade (PAT) D. KUSUM 9. The legal basis enabling issuance of carbon credit certificates is attributed to: A. Environment Protection Act, 1986 B. Energy Conservation (Amendment) Act, 2022 C. Forest (Conservation) Act, 1980 D. Electricity Act, 2003 10. The Bureau of Energy Efficiency (BEE), as described, is best understood as: A. A purely advisory NGO platform B. A quasi-regulatory body for energy efficiency under the Energy Conservation Act framework C. A state government department under agriculture D. An intergovernmental treaty organisation 11. The reported lifecycle outcome of PAT in designated sectors is a reduction in emissions intensity by: A. 1–5% B. 5–10% C. 15–25% D. 35–45% 12. The renewable capacity ambition cited for 2030 is: A. 200 GW of fossil capacity B. 300 GW of nuclear capacity C. 500 GW of non-fossil fuel-based capacity D. 750 GW of coal-based capacity 13. Mission LiFE, as described, primarily emphasizes: A. Technology-only decarbonisation through industrial CCS mandates B. Behavioural change and sustainable lifestyle practices at scale C. Trade sanctions against high emitters D. Mandatory rationing of household electricity 14. The Green Credit mechanism described is best represented by which sequence? A. Credits issued before planting; no verification required B. Plantation within two years; maintenance for

More Details

Somnath Swabhiman Parv: A Millennium of Resilience and Living Heritage

Somnath Swabhiman Parv: A Millennium of Resilience and Living Heritage     1. Somnath Swabhiman Parv (8–11 January 2026) marks 1,000 years since Mahmud of Ghazni’s first recorded assault on Somnath Temple in January 1026 at Prabhas Patan, Gujarat, Saurashtra, on western coastline. 2. Somnath is revered as the first among twelve Jyotirlingas, positioned at the start of India’s sacred spiritual geography, and remains a living symbol of civilisational continuity beside the Arabian Sea. 3. The commemoration emphasises resilience and civilisational self-respect, recalling cycles of destruction and rebuilding across centuries, and the unwavering faith of devotees who restored the shrine after each assault, repeatedly, again. 4. 2026 coincides with 75 years since the present Somnath Temple reopened on 11 May 1951 after Independence, linking medieval memory with modern reconstruction and strengthened national cultural confidence even today. 5. Across four days, Somnath became a centre of spiritual activity and cultural reflection, hosting discourses, devotional music, and programmes while pilgrims participated in rituals that reinforced shared remembrance and community. 6. A 72-hour Akhand Omkar chanting anchored the Parv; on 10 January 2026 the Prime Minister joined chanting and watched a drone show, then symbolically led Shaurya Yatra on 11 January. 7. Tradition associates Prabhas Tirtha with Chandra worshipping Shiva, relief from a curse, and enduring sanctity, situating Somnath within ancient sacred landscapes that shaped regional pilgrimage routes and memory over centuries. 8. Historical accounts describe successive temples erected with varied materials, reflecting evolving craftsmanship and resources, before the eleventh century introduced repeated raids, demolitions, and reconstructions that hardened Somnath’s lasting symbolic stature. 9. On 12 November 1947, Diwali day, Sardar Vallabhbhai Patel visited Somnath’s ruins and resolved to rebuild; reconstruction advanced through public contributions, reinforcing post-independence confidence and civic participation for national renewal. 10. The present temple, built in Kailash Mahameru Prasad architectural style, was consecrated on 11 May 1951 in the presence of President Rajendra Prasad, signifying reopening and reaffirmation of civilisational self-respect. 11. Somnath’s complex includes, in present form, Garbhagriha, Sabhamandap, and Nrityamandap, rising beside the Arabian Sea, crowned by a 150-foot shikhar and 10-tonne kalash, with a 27-foot dhwajdand flagpole marking identity. 12. Annual footfall stays around 92–97 lakh devotees; Bilva Pooja draws about 13.77 lakh, and Maha Shivratri 2025 saw about 3.56 lakh, indicating sustained ritual magnetism and capacity throughout the year. 13. Cultural outreach includes a Light and Sound Show launched in 2003, upgraded in 2017 with narration and 3D laser technology, drawing over 10 lakh visitors in three years, notably so. 14. Declared a Swachh Iconic Place in 2018, Somnath uses sustainability measures: flower vermicompost for 1,700 Bilva trees, plastic-to-paver blocks under Mission LiFE, about 4,700 produced monthly, plus sewage treatment systems. 15. Women’s employment is substantial: Somnath Temple Trust counts 262 women among 906 staff; about 363 women earn roughly ₹9 crore annually through Bilva Van management, prasad distribution, and dining services.   Key Takeaways Somnath Swabhiman Parv (8–11 January, 2026) commemorates 1,000 years since the first attack by Mahmud of Ghazni on the Somnath Temple in 1026. The Parv celebrates the enduring spirit of India’s civilisation and rich cultural and spiritual heritage. Prime Minister Narendra Modi to visit Somnath on 10–11 January, 2026 to participate in key commemorative events. Somnath temple draws 92–97 lakh devotees annually. Women play a central role at Somnath. The Somnath Temple Trust employs 262 women among 906 employees; in total around 363 women get employment generating about ₹9 crore annually through the temple   MCQ:   1. Somnath Swabhiman Parv (8–11 January 2026) primarily commemorates: A. 1,000 years since the first recorded attack on Somnath in January 1026 B. 1,000 years since the construction of the present temple in 1026 C. 75 years since the first Jyotirlinga was established at Prabhas Patan D. 500 years since the last reconstruction of Somnath in 1526 2. Which of the following pairs is correctly matched? A. Present temple reopened to devotees — 11 May 1950 B. Consecration of present temple — 11 May 1951 C. Diwali-day Patel visit — 12 November 1951 D. Light and Sound Show launched — 2017 3. Consider the following statements: 1. Somnath is associated with Prabhas Tirtha near Veraval in Gujarat. 2. Somnath is described as the first among the twelve Jyotirlingas. 3. The Parv is conceived mainly as a remembrance of destruction. Which of the statements given above are correct? A. 1 and 2 only B. 2 and 3 only C. 1 and 3 only D. 1, 2 and 3 4. The core symbolic practice highlighted during the Parv is: A. 72-hour Akhand Omkar chanting B. 72-day continuous Bilva Pooja C. 24-hour Akhand Damru recital D. 108-hour continuous recitation of Dwadasha Jyotirlinga Stotram 5. The Prime Minister’s participation during 10–11 January 2026 includes: A. Leading Shaurya Yatra on 10 January and drone show on 11 January B. Joining Omkar chanting and witnessing a drone show on 10 January C. Addressing the gathering before offering prayers on 10 January only D. Performing consecration rituals of the present temple on 11 January 6. Assertion (A): The Somnath narrative is presented as an unbroken cycle of revival. Reason (R): The temple was rebuilt after repeated demolitions through collective resolve of devotees. A. Both A and R are true, and R is the correct explanation of A B. Both A and R are true, but R is not the correct explanation of A C. A is true, but R is false D. A is false, but R is true 7. The architectural style explicitly mentioned for the present Somnath Temple is: A. Dravida Vimana B. Vesara Nagara C. Kailash Mahameru Prasad D. Maru-Gurjara Solanki 8. Which of the following correctly describes the temple’s vertical elements? A. Shikhar 150-foot; Kalash 10-tonne; Dhwajdand 27-foot B. Shikhar 27-foot; Kalash 10-tonne; Dhwajdand 150-foot C. Shikhar 150-foot; Kalash 27-tonne; Dhwajdand 10-foot D. Shikhar 10-foot; Kalash 150-tonne; Dhwajdand 27-foot 9. The present temple complex is stated to comprise: A. Garbhagriha, Sabhamandap, Nrityamandap B. Garbhagriha, Mahamandap, Antarala C. Sabhamandap, Pradakshinapath, Vimana D. Nrityamandap, Gopuram, Kalyanamandap 10.

More Details

India’s Groundwater Revival: Recharge Gains, Quality Challenges, and Key Management Initiatives

India’s Groundwater Revival: Recharge Gains, Quality Challenges, and Key Management Initiatives   “We must adopt the mantra of ‘Reduce, Reuse, Recharge, and Recycle’ to secure the nation’s water future” ~Prime Minister Shri Narendra Modi     1. Total annual groundwater recharge increased by 15 billion cubic meters in 2024, while annual extraction declined by 3 billion cubic meters compared with 2017. 2. Dynamic groundwater assessment 2024 estimates total annual recharge at 446.90 BCM, extractable resources at 406.19 BCM, and annual extraction at 245.64 BCM for planning. 3. Improved groundwater conditions were recorded in 128 assessment units compared with 2023, reflecting benefits from water bodies, tanks, conservation structures, and better management locally. 4. Recharge from tanks, ponds, and water control systems rose by 0.39 BCM in 2024 relative to 2023, continuing an upward trend nationwide for resilience. 5. Between 2017 and 2024, recharge from tanks, ponds and water control systems increased by 11.36 BCM, from 13.98 to 25.34 BCM overall over time. 6. Assessment units in the Safe category rose from 62.6% in 2017 to 73.4% in 2024, indicating broader sustainability gains across regions in many basins. 7. Over-exploited assessment units declined from 17.24% in 2017 to 11.13% in 2024, signalling reduced stress on aquifers nationwide and improving allocation for users sustainably. 8. Groundwater quality threats include arsenic, fluoride, chloride, uranium, and nitrate, creating serious health risks through direct toxicity and long-term exposure pathways in drinking supplies. 9. Elevated electrical conductivity can indicate agricultural runoff, industrial discharge, or saline intrusion, while iron contamination may cause gastrointestinal issues, requiring careful monitoring and treatment. 10. Groundwater quality assessment uses data from over 15,200 monitoring locations and 4,982 trend stations, supporting identification of critical contamination areas nationwide for timely action. 11. About 81% of groundwater samples are suitable for irrigation; in North-Eastern states, 100% samples were rated excellent for irrigation quality, supporting productivity and livelihoods. 12. MGNREGS includes water conservation and water harvesting works, strengthening rural water security and supporting recharge through community-built infrastructure assets across villages, fields, and commons. 13. Jal Shakti Abhiyan, launched in 2019, is in its fifth phase as Catch the Rain 2024, promoting rainwater harvesting via convergence in rural areas. 14. Atal Bhujal Yojana targets water-stressed gram panchayats in 80 districts across seven states, focusing on participatory groundwater management and demand-side measures with local plans. 15. Master Plan for Artificial Recharge to Groundwater proposes 1.42 crore recharge and rainwater harvesting structures to harness 185 BCM rainfall through interventions at scale. Ground Water Assessment and Management Initiatives These positive outcomes are the result of collaborative efforts between state and central governments. The Government of India has launched various initiatives to preserve water and ensure its availability for future generations. Key schemes include:   • Mahatma Gandhi National Rural Employment Guarantee Scheme (MGNREGS): Includes water conservation and water harvesting structures, enhancing rural water security. • 15th Finance Commission Grants: Provides financial assistance to states for rainwater harvesting and other water conservation activities. • Jal Shakti Abhiyan (JSA): Launched in 2019, now in its 5th phase (“Catch the Rain” 2024), focusing on rainwater harvesting and water conservation through convergence. • Atal Mission for Rejuvenation and Urban Transformation (AMRUT) 2.0: Supports rainwater harvesting via stormwater drains and promotes groundwater recharge through ‘Aquifer Management Plans’. • Ministry of Housing & Urban Affairs Guidelines: Promotes rainwater harvesting and water conservation through UBBL (Delhi, 2016), MBBL (2016), and URDPFI Guidelines (2014). • Atal Bhujal Yojana (2020): Targets water-stressed Gram Panchayats in 80 districts across 7 states, focusing on participatory groundwater management. • Pradhan Mantri Krishi Sinchai Yojana (PMKSY): Expands irrigation coverage and improves water use efficiency via Har Khet Ko Pani and water body rejuvenation components. • Bureau of Water Use Efficiency (BWUE): Set up under the National Water Mission on 20.10.2022 to promote improved water use efficiency across sectors. • Mission Amrit Sarovar (2022): Aims to create or rejuvenate 75 Amrit Sarovars in every district for water harvesting and conservation. • National Aquifer Mapping (NAQUIM): Completed for over 25 lakh sq. km, supporting groundwater recharge planning and conservation strategies. • Master Plan for Artificial Recharge to Groundwater (2020): Plans for 1.42 crore rainwater harvesting and recharge structures to harness 185 BCM of rainfall. • CGWB Demonstration Projects: Implements artificial recharge projects under regulation schemes to enable replication by states in suitable hydro-geological settings. • National Water Policy (2012): Advocates rainwater harvesting, water conservation, and augmentation of availability through direct use of rainfall. • Watershed Development Component of PMKSY (WDC-PMKSY): Focuses on rainfed and degraded lands with soil conservation, rainwater harvesting, and livelihoods development. • National Water Awards (2018): Recognizes contributions to water conservation and management; 6th National Water Awards application deadline extended to 31 January 2025.     MCQ:   1. With reference to groundwater trends in 2024, consider the following statements: 1. Total annual groundwater recharge increased compared to the 2017 assessment. 2. Annual groundwater extraction declined compared to the 2017 assessment. Which of the statements given above is/are correct? A. 1 only B. 2 only C. Both 1 and 2 D. Neither 1 nor 2 2. As per the dynamic groundwater assessment 2024, the total annual groundwater recharge is assessed at: A. 245.64 BCM B. 406.19 BCM C. 446.90 BCM D. 15 BCM 3. As per the dynamic groundwater assessment 2024, the extractable groundwater resource is assessed at: A. 245.64 BCM B. 406.19 BCM C. 446.90 BCM D. 128 BCM 4. As per the dynamic groundwater assessment 2024, the annual groundwater extraction is assessed at: A. 245.64 BCM B. 406.19 BCM C. 446.90 BCM D. 25.34 BCM 5. Improvements in groundwater conditions in 2024, compared to 2023, were recorded in how many assessment units? A. 73 units B. 81 units C. 128 units D. 185 units 6. Recharge from tanks, ponds and water control systems (WCS) in 2024 increased by how much compared to 2023? A. 0.39 BCM B. 3.90 BCM C. 11.36 BCM D. 15.00 BCM 7. Recharge from tanks, ponds and WCS increased from 13.98 BCM in 2017 to 25.34

More Details

Mission 100% Electrification: Transforming Indian Railways with Near-Complete Network Electrification and Solar Power Integration

Mission 100% Electrification: Transforming Indian Railways with Near-Complete Network Electrification and Solar Power Integration       Key Takeaways   Indian Railways has electrified about 99.2% of its network by November 2025, making it one of the world’s most extensively electrified rail systems.   Electrification pace has surged from 1.42 km/day (2004–2014) to over 15 km/day in 2019- 2025, marking a massive acceleration in modernization.   By November 2025, Indian Railways expanded its solar power capacity to 898 MW, up from 3.68 MW in 2014, marking a transformational growth in renewable energy adoption.       1. Indian Railways electrified about 99.2% of its network by November 2025, making the system among the world’s most extensively electrified rail networks. 2. Electrification speed rose from about 1.42 km per day during 2004–2014 to over 15 km per day in 2019–2025. 3. India’s first electric train ran in 1925 between Bombay Victoria Terminus and Kurla Harbour, using a 1500 Volt DC traction system. 4. By Independence, only 388 route kilometers were electrified, while coal and diesel locomotives continued to dominate most railway operations nationwide. 5. Electrified track share increased from 24% in 2000 to 40% in 2017, then crossed 96% by end-2024. 6. As of November 2025, 69,427 route kilometers were electrified, with 46,900 route kilometers completed between 2014 and 2025. 7. Broad Gauge network totals about 70,001 route kilometers; 99.2% is electrified, leaving only 574 route kilometers pending work. 8. Twenty-five States and Union Territories achieved 100% Broad Gauge electrification, with no remaining route kilometers pending electrification completion. 9. Residual electrification remains in five States, with balances: Assam 197 km, Karnataka 151 km, Tamil Nadu 117 km, Rajasthan 93 km, Goa 16 km. 10. Electrification supports sustainability and economic growth by reducing environmental impact, improving energy security, enhancing operational efficiency, and enabling development along corridors. 11. India’s electrification level compares strongly with major networks, exceeding several large systems, while Switzerland is fully electrified and China remains around eighty-two percent. 12. Indian Railways expanded solar capacity to 898 MW by November 2025, rising from 3.68 MW in 2014, indicating transformational renewable adoption. 13. Solar installations cover 2,626 railway stations, creating a nationwide clean-energy footprint across diverse operational zones and geographic regions for daily services. 14. Of 898 MW solar capacity, 629 MW is used for traction, while 269 MW supports non-traction needs like stations, workshops, buildings, and quarters. 15. Modern electrification uses mechanised cylindrical foundations and automatic wiring trains, accelerating overhead equipment installation with accurate tension control and consistent construction quality.   MCQ: 1. As of November 2025, approximately what share of the Indian Railways network had been electrified? A. 89.2% B. 94.5% C. 99.2% D. 100% 2. Electrification pace increased from about 1.42 km/day (2004–2014) to over 15 km/day mainly during: A. 2010–2014 B. 2014–2019 C. 2019–2025 D. 2021–2024 3. India’s first electric train (1925) ran between: A. Bombay Victoria Terminus and Kurla Harbour B. Howrah and Sealdah C. Madras Central and Tambaram D. Delhi and Agra Cantt 4. The traction system used on India’s first electric train in 1925 was: A. 750 V DC B. 1500 V DC C. 25 kV AC D. 15 kV AC 5. By the time India gained independence, electrified route kilometers were about: A. 188 RKMs B. 388 RKMs C. 3,880 RKMs D. 6,388 RKMs 6. Electrified track share rose from 24% in 2000 to about 40% in: A. 2007 B. 2012 C. 2017 D. 2020 7. Electrified track share crossed 96% by the end of: A. 2022 B. 2023 C. 2024 D. 2025 8. As of November 2025, electrified route kilometers were approximately: A. 46,900 RKMs B. 57,400 RKMs C. 69,427 RKMs D. 70,001 RKMs 9. Route kilometers electrified between 2014 and 2025 were about: A. 19,427 RKMs B. 36,900 RKMs C. 46,900 RKMs D. 69,427 RKMs 10. The total Broad Gauge network length cited was closest to: A. 60,001 RKM B. 65,427 RKM C. 69,427 RKM D. 70,001 RKM 11. The balance Broad Gauge route kilometers pending electrification across five States was: A. 574 RKM B. 740 RKM C. 1,574 RKM D. 5,740 RKM 12. How many States/Union Territories were reported as 100% electrified on Broad Gauge? A. 15 B. 20 C. 25 D. 30 13. As of November 2025, Indian Railways’ commissioned solar power capacity was: A. 98 MW B. 398 MW C. 898 MW D. 1,898 MW 14. Of the commissioned solar capacity, the portion used for traction purposes was: A. 269 MW B. 629 MW C. 898 MW D. 2,626 MW 15. Solar power installations were reported across how many railway stations? A. 629 B. 898 C. 1,426 D. 2,626

More Details

Catalyzing Indigenous Chip Design: Key Features and Outcomes of the Design Linked Incentive (DLI) Scheme

Catalyzing Indigenous Chip Design: Key Features and Outcomes of the Design Linked Incentive (DLI) Scheme     Key Takeaways Semiconductor chip design is the main value driver, contributing up to 50% of value addition, 20–50% of Bill of Materials cost (BOM), and 30–35% of global semiconductor sales via the fabless segment. MeitY’s Design Linked Incentive (DLI) Scheme under the Semicon India Programme aims to build a self-reliant, globally competitive chip design ecosystem. 24 DLI-supported chip design projects target strategic sectors including video surveillance, drone detection, energy metering, microprocessors, satellite communications, and IoT SoCs. DLI supported projects are scaling rapidly, with 16 tape-outs, 6 ASICs chips, 10 patents, 1,000+ engineers engaged, and over 3× private investment leveraged.       1. Chip design drives semiconductor value, contributing up to half value addition, 20–50% bill of materials cost, and 30–35% global sales in fabless segment overall. 2. Design Linked Incentive scheme aims to build a self-reliant, globally competitive fabless ecosystem by supporting domestic startups, MSMEs, and indigenous intellectual property creation domestically. 3. Twenty-four supported chip design projects target strategic domains: video surveillance, drone detection, energy metering, microprocessors, satellite communications, and broadband or IoT systems-on-chip security applications. 4. Supported projects show rapid scaling: sixteen tape-outs completed, six ASIC chips fabricated, ten patents filed, over one thousand engineers engaged, leveraging triple private investment. 5. Fabless companies capture high strategic value because design and IP determine product intelligence, efficiency, and security, while requiring modest capital expenditure relative to fabrication. 6. Eligibility covers startups and MSMEs for incentives plus design infrastructure, while other domestic companies can receive financial incentives for deploying semiconductor designs successfully nationwide. 7. Product design support reimburses up to fifty percent eligible expenditure, capped at fifteen crore rupees per application, covering ICs, chipsets, SoCs, systems, IP cores. 8. Deployment incentive provides six to four percent of net sales turnover for five years, capped at thirty crore rupees, subject to cumulative sales thresholds. 9. ChipIN Centre provides shared infrastructure: remote national EDA tool grid, IP core repository access, MPW prototyping fiscal support, and post-silicon validation assistance for startups. 10. ChipIN democratized advanced EDA access for about one lakh engineers and students across four hundred organizations, including academic institutions and many supported startups nationwide. 11. National shared EDA Grid recorded 54,03,005 cumulative usage hours by ninety-five supported startups as of 2 January 2026, indicating strong nationwide tool adoption rates. 12. Outcomes include ten patents, sixteen tape-outs, six silicon-proven chips, over one thousand specialized engineers trained or engaged, and more than 140 reusable IP cores. 13. Semicon India Programme, with seventy-six thousand crore rupees outlay, supports semiconductor and display manufacturing and design ecosystem, with implementation support from C-DAC as agency. 14. Chips to Startup programme builds capacity across institutions to generate eighty-five thousand industry-ready chip-design professionals, while microprocessor efforts produced VEGA, SHAKTI, AJIT families domestically. 15. Success cases include motor-control BLDC chips, indigenous RISC-V processor IPs, AI-capable surveillance SoCs in 12 nm, broadband GPON solutions, and radar-on-chip development pipelines globally.       MCQ:     1. Semiconductor chip design contributes up to which share of value addition in the semiconductor value chain? A. 10% B. 25% C. 50% D. 75% 2. Design and IP typically account for what share of a semiconductor’s value, as highlighted in the explainer? A. Less than 10% B. About one-third C. More than half D. Nearly all of it 3. Under the scheme, reimbursement for product design support is capped at: A. ₹10 crore per application B. ₹15 crore per application C. ₹20 crore per application D. ₹30 crore per application 4. Deployment-linked incentive under the scheme is provided as: A. 10%–8% of gross sales for 3 years B. 6%–4% of net sales turnover for 5 years C. 4%–2% of net sales turnover for 10 years D. Fixed grant of ₹30 crore for 5 years 5. The deployment-linked incentive cap per application is: A. ₹15 crore B. ₹25 crore C. ₹30 crore D. ₹76,000 crore 6. Minimum cumulative net sales required over Years 1–5 for startups/MSMEs is: A. ₹50 lakh B. ₹1 crore C. ₹2 crore D. ₹5 crore 7. Minimum cumulative net sales required over Years 1–5 for other domestic companies is: A. ₹1 crore B. ₹2 crore C. ₹5 crore D. ₹10 crore 8. The design must be successfully deployed in electronic products for obtaining: A. Product design reimbursement B. Access to EDA tools C. Deployment-linked incentive D. MPW prototyping fiscal support 9. Which set correctly lists the main design infrastructure supports offered through the ChipIN Centre? A. EDA grid, IP core repository, MPW prototyping, post-silicon validation B. Waiver of customs duties, land subsidy, power tariff discount, export rebate C. Patent filing waiver, GST exemption, freight subsidy, credit guarantee D. Salary support, rent subsidy, marketing grant, equity infusion 10. The scheme was launched in: A. December 2019 B. December 2020 C. December 2021 D. December 2022 11. About 1 lakh engineers and students across 400 organizations gained access to advanced EDA tools primarily through: A. A private EDA marketplace B. A centralized facility user base via ChipIN C. Bilateral technology transfer treaties D. A semiconductor import substitution tariff 12. As of 2 January 2026, cumulative usage recorded on the shared EDA Grid was: A. 5,40,305 hours B. 54,03,005 hours C. 5,43,00,500 hours D. 4,05,300 hours 13. Which of the following outcomes is correctly matched with the supported ecosystem performance? A. 16 patents filed, 10 tape-outs completed, 6 chips designed B. 10 patents filed, 16 tape-outs completed, 6 chips fabricated C. 6 patents filed, 16 chips fabricated, 10 tape-outs completed D. 10 tape-outs filed, 6 patents completed, 16 chips fabricated 14. The total outlay mentioned for the broader programme supporting manufacturing and design is: A. ₹7,600 crore B. ₹16,000 crore C. ₹76,000 crore D. ₹1,76,000 crore 15. Chips to Startup capacity-building target is to generate approximately: A. 8,500 industry-ready professionals B. 35,000 industry-ready professionals C. 85,000 industry-ready professionals D. 1,85,000 industry-ready professionals      

More Details

Green Hydrogen Mission: Targets, Certification, Infrastructure, and Strategic Interventions

Green Hydrogen Mission: Targets, Certification, Infrastructure, and Strategic Interventions           Key Takeaways     India targets 5 MMT of Green Hydrogen production annually by 2030. A port-based Green Hydrogen pilot has been commissioned at V.O. Chidambaranar Port, and Deendayal Port Authority, Kandla has commissioned a megawatt-scale, indigenous Green Hydrogen Facility Hydrogen mobility pilots launched across 10 routes, involving 37 fuel cell and hydrogen internal combustion engine vehicles. The Mission is expected to attract over ₹8 lakh crore in investments and reduce fossil fuel imports by more than ₹1 lakh crore.         1. India aims to produce 5 million metric tonnes of green hydrogen annually by 2030, strengthening energy security, supporting industrial growth, and decarbonising hard-to-abate sectors nationwide. 2. Green hydrogen is produced through electrolysis powered by renewable electricity; it qualifies when lifecycle emissions remain within 2 kg CO2-equivalent per kilogram of hydrogen produced. 3. A national green hydrogen programme launched in 2023 with an initial outlay of ₹19,744 crore through 2029–30, covering incentives, pilots, research, and ecosystem development. 4. By 2030, around 125 GW of new renewable capacity is planned to support hydrogen, with investment exceeding ₹8 lakh crore and an estimated 6 lakh jobs. 5. The programme targets reducing fossil fuel imports by over ₹1 lakh crore and avoiding nearly 50 million tonnes of greenhouse emissions annually by 2030. 6. As of May 2025, nineteen companies received allocations totalling 862,000 tonnes per year of hydrogen capacity, while fifteen firms secured 3,000 MW electrolyser manufacturing capacity. 7. Strategic interventions provide financial incentives up to 2029–30, with ₹17,490 crore to scale domestic electrolyser manufacturing and accelerate deployment nationwide. 8. Three ports—Deendayal, V.O. Chidambaranar, and Paradip—were identified as hydrogen hubs to integrate production, consumption, logistics, and future export pathways. 9. A certification scheme launched in April 2025 verifies lifecycle emissions and renewable sourcing; a final certificate is required for subsidised or domestically sold hydrogen. 10. The Bureau of Energy Efficiency serves as nodal authority, accrediting agencies to monitor and certify projects, improving transparency, traceability, and market credibility. 11. A strategic innovation partnership promotes government–industry–academia collaboration through consortia across the value chain, leveraging national research and engineering institutions. 12. A ₹400 crore R&D scheme supports 23 projects on production, storage, safety, and end-use applications; a ₹100 crore call supports startups up to ₹5 crore. 13. In fertilisers, green ammonia can replace fossil-based feedstock; a long-term supply auction aggregated 7.24 lakh tonnes per year at ₹55.75 per kg delivered domestically. 14. Five road-transport pilots deploy 37 hydrogen vehicles and nine refuelling stations across ten routes, including fuel-cell buses and hydrogen internal combustion trucks. 15. Port pilots include a 10 Nm3 per hour plant for lighting and charging, along with green methanol bunkering to support a Kandla–Tuticorin coastal corridor.               MCQ: 1. With reference to green hydrogen, consider the following statements: 1. It is produced using electrolysis powered by renewable electricity. 2. Its “green” status may depend on lifecycle emissions per kilogram of hydrogen. Which of the statements given above is/are correct? a) 1 only b) 2 only c) Both 1 and 2 d) Neither 1 nor 2 2. Consider the following: 1. Annual green hydrogen production target 2. Year by which the target is to be achieved The correct pairing is: a) 5 million metric tonnes — 2027 b) 5 million metric tonnes — 2030 c) 50 million metric tonnes — 2030 d) 5 million metric tonnes — 2040 3. With reference to a national programme on green hydrogen, consider the following statements: 1. It includes support for incentives, pilots, and research activities. 2. Its implementation horizon extends beyond 2040. Which of the statements given above is/are correct? a) 1 only b) 2 only c) Both 1 and 2 d) Neither 1 nor 2 4. Consider the following statements about lifecycle emissions threshold used for certification: 1. The threshold is expressed as kg CO2-equivalent per kg of hydrogen. 2. The threshold value mentioned is 2 kg CO2-equivalent per kg hydrogen. Which of the statements given above is/are correct? a) 1 only b) 2 only c) Both 1 and 2 d) Neither 1 nor 2 5. Which of the following is the most direct policy purpose of a certification scheme for green hydrogen? a) Fixing consumer retail prices for hydrogen b) Establishing traceability of renewable sourcing and lifecycle emissions c) Mandating export quotas for hydrogen producers d) Replacing all safety standards with a single guideline 6. Consider the following pairs: 1. Nodal authority role — Accrediting agencies for monitoring and certification 2. Operational focus — Increasing transparency and market credibility Which of the pairs given above is/are correctly matched? a) 1 only b) 2 only c) Both 1 and 2 d) Neither 1 nor 2 7. With reference to manufacturing support under a strategic intervention, consider the following statements: 1. It aims to expand domestic electrolyser manufacturing capacity. 2. It provides financial incentives up to 2029–30. Which of the statements given above is/are correct? a) 1 only b) 2 only c) Both 1 and 2 d) Neither 1 nor 2 8. Consider the following: 1. Allocations for annual green hydrogen production capacity 2. Allocation for electrolyser manufacturing capacity Which of the following best matches the quantities mentioned? a) 862,000 tonnes per year; 3,000 MW b) 3,000 tonnes per year; 862,000 MW c) 862,000 MW; 3,000 tonnes per year d) 8,620,000 tonnes per year; 300 MW 9. Which of the following sets of locations was recognised as green hydrogen hubs among ports? a) Kandla, Mumbai, Chennai b) Deendayal, V.O. Chidambaranar, Paradip c) Visakhapatnam, Kochi, Kolkata d) JNPT, Mormugao, Haldia 10. Consider the following statements about renewable capacity addition linked with hydrogen scaling: 1. The plan indicates addition of about 125 GW of new renewable capacity. 2. The intent is to support hydrogen production requirements. Which of the statements given above is/are correct? a) 1 only b) 2 only c) Both 1 and 2 d) Neither 1 nor 2 11. With reference to

More Details

Edible Oils and Oilseeds: Production, Import Dependence, and Mission-Based Expansion

Edible Oils and Oilseeds: Production, Import Dependence, and Mission-Based Expansion       Key Takeaways According to a NITI Aayog report (August 2024), India ranks firstglobally in the production of rice bran oil, castor seed, safflower, sesame, and niger. National Mission on Edible Oils (NMEO)aims to strengthen the country’s oilseed ecosystem and achieve Atmanirbharta in edible oil production. The NMEO–OP (Oil Palm) aims to bring 5 lakh hectaresunder oil palm cultivation by 2025–26 and increase crude palm oil production to 28 lakh tonnes by 2029–30. By November 2025, 50 lakh hectareshave been covered, bringing the total coverage of oil palm in the country to 6.20 lakh hectares. Crude Palm Oil (CPO) production has risen from 1.91 lakh tonnes in 2014-15 to 3.80 lakh tonnes in 2024-25. NMEO–OS (Oil Seeds) aims to increase oilseed production from 39 to 7 million tonnesby 2030–31 through cluster-based interventions and improved seed systems.       1. Edible oils are central to food and nutritional security; oilseeds supply dietary fats, energy, vitamins, and support farmer livelihoods as key cash crops nationwide. 2. Domestic edible oil demand has outpaced production; rural consumption rose to 10.58 kg/year and urban to 11.78 kg/year by 2022-23, indicating strong shift overall. 3. Total edible oil output was 12.18 million tonnes in 2023-24, meeting about 44% of demand, leaving substantial reliance on imports for stability nationally today. 4. Import dependence declined from 63.2% in 2015-16 to 56.25% in 2023-24, yet rising consumption still pressures foreign exchange, prices, and supply security for households. 5. India contributes 15-20% of global oilseed area but only 6-7% of vegetable oil output, reflecting yield gaps, limited expansion, and efficiency constraints per hectare. 6. Nine major oilseeds occupy 14.3% of gross cropped area; about 76% oilseed area is rainfed, heightening climate vulnerability, yield instability, and income risk overall. 7. Rajasthan, Madhya Pradesh, Gujarat, and Maharashtra contribute over 77% of national oilseed output, showing regional concentration, crop specialisation, and supply dependence in key years. 8. National Mission on Edible Oils uses two pillars: expand oil palm cultivation and improve traditional oilseeds productivity, seed systems, processing capacity, and market linkages. 9. Oil palm yields far more oil per hectare than traditional oilseeds; Andhra Pradesh and Telangana account for about 98% of current production, leading adoption. 10. Oil palm mission targets 6.5 lakh hectares by 2025-26 and crude palm oil 28 lakh tonnes by 2029-30; coverage reached 6.20 lakh hectares nationally. 11. Price assurance for fresh fruit bunches links farmer returns to a viability price, cushioning international crude palm oil volatility and improving predictable income stability. 12. Input assistance for oil palm rose to Rs. 29,000 per hectare; added support covers maintenance, intercropping, drip irrigation, and old garden rejuvenation support packages. 13. Oilseeds mission targets 33 million hectares, 69.7 million tonnes output, and 2,112 kg/ha yield by 2030-31, raising domestic edible oil availability over seven years. 14. Over 600 value-chain clusters deliver quality seeds, training, and advisory services; post-harvest infrastructure support improves collection, extraction efficiency, recovery, and farmer returns at scale. 15. Seed planning and traceability use a rolling plan portal; SHGs and Krishi Sakhis support data updates, while research notified 432 varieties since 2014 commercially.     MCQ:   1. With reference to edible oils, consider the following statements: I. They are a major source of dietary fats and support nutritional security. II. Oilseeds function as important cash crops for many farming households. Which of the statements given above is/are correct? A. I only B. II only C. Both I and II D. Neither I nor II 2. As per the given data, the level of import dependence for edible oils in 2023–24 was closest to: A. 36% B. 44% C. 56% D. 63% 3. Consider the following pairs: I. Rural per capita edible oil consumption (2022–23) — 10.58 kg/year II. Urban per capita edible oil consumption (2022–23) — 11.78 kg/year Which of the pairs given above is/are correctly matched? A. I only B. II only C. Both I and II D. Neither I nor II 4. Total edible oil production mentioned for 2023–24 was: A. 8.18 million tonnes B. 10.18 million tonnes C. 12.18 million tonnes D. 14.18 million tonnes 5. India’s share in global oilseed area and vegetable oil output is best described as: A. 5–7% area; 15–20% output B. 15–20% area; 6–7% output C. 25–30% area; 10–12% output D. 10–12% area; 25–30% output 6. With reference to oilseeds cultivation, consider the following statements: I. Nine major oilseeds occupy about 14.3% of the gross cropped area. II. Around three-fourths of oilseed area is rainfed. Which of the statements given above is/are correct? A. I only B. II only C. Both I and II D. Neither I nor II 7. Which of the following groups of States together contribute over 77% of national oilseed output, as stated? A. Punjab, Haryana, Uttar Pradesh, Bihar B. Rajasthan, Madhya Pradesh, Gujarat, Maharashtra C. Andhra Pradesh, Telangana, Tamil Nadu, Karnataka D. West Bengal, Odisha, Chhattisgarh, Jharkhand 8. The mission framework described for edible oils is based primarily on: A. Import substitution through tariff bans alone B. Expansion of oil palm and improvement of traditional oilseeds C. Replacement of oilseeds by cereals in rainfed areas D. Exclusive focus on refining capacity without farm interventions 9. Oil palm is emphasised in policy primarily because it: A. Requires no irrigation and thrives only in arid climates B. Has significantly higher oil yield per hectare than traditional oilseeds C. Produces edible oil without any processing requirement D. Has the shortest gestation period among all crops 10. Current oil palm production is described as being concentrated mainly in: A. Andhra Pradesh and Telangana B. Rajasthan and Gujarat C. Punjab and Haryana D. Odisha and West Bengal 11. The oil palm expansion target mentioned for 2025–26 was: A. 2.5 lakh hectares B. 4.5 lakh hectares C. 6.5 lakh hectares D. 8.5 lakh hectares 12. The crude palm oil production target mentioned for 2029–30 was: A. 18 lakh tonnes B. 28 lakh tonnes C. 38 lakh tonnes D. 48 lakh tonnes 13. Price assurance for fresh fruit bunches is designed mainly to: A. Fix prices permanently regardless of market conditions B. Link farmer returns

More Details

India–Jordan Relations: Key Developments and Areas of Cooperation

India–Jordan Relations: Key Developments and Areas of Cooperation     Key Takeaways PM Narendra Modi visited Jordan on December 15-16, 2025, his first full-fledged visit to the country. Five MoUs were signed in the areas of renewable energy, water resource management, cultural exchange, digital solution and twinning between Petra and Ellora This year is the 75th anniversary of the establishment of diplomatic relations between the two countries. India is Jordan’s third largest trading partner. The two countries aim to enhance bilateral trade to US$ 5 billion over the next 5 years. Jordan is a leading supplier of phosphates and potash fertilizers for India. Around 17,500 Indian nationals currently live in Jordan, mostly working in textiles, construction, manufacturing, healthcare etc.     1. The Prime Minister visited Jordan on 15–16 December 2025, marking his first full-fledged bilateral visit and holding detailed discussions with King Abdullah II. 2. The visit coincided with the seventy-fifth anniversary of diplomatic relations, highlighting the long-standing partnership formally established between India and Jordan in 1950. 3. Five memoranda of understanding were signed covering renewable energy, water resource management, cultural exchange, digital solutions, and twinning of Petra with Ellora. 4. India is Jordan’s third largest trading partner, with both sides proposing to enhance bilateral trade to five billion US dollars within five years. 5. Jordan serves as a leading supplier of phosphates and potash fertilizers to India, supporting agricultural and fertilizer security through sustained commercial cooperation. 6. Around seventeen thousand five hundred Indian nationals currently reside in Jordan, employed across textiles, construction, manufacturing, healthcare, education, and information technology sectors. 7. High-level political engagement includes regular leadership interactions, foreign office consultations, and structured dialogue mechanisms sustaining momentum in bilateral relations. 8. Trade and economic cooperation is anchored by institutional frameworks such as the Trade and Economic Joint Committee established under the 1976 Trade Agreement. 9. Joint ventures like the Jordan India Fertiliser Company produce phosphoric acid for Indian markets, reflecting deep integration in fertilizer supply chains. 10. Defence cooperation is guided by a memorandum signed in 2018, complemented by exchanges between armed forces and participation in joint defence-related events. 11. The India–Jordan Center of Excellence in Information Technology was inaugurated in 2021 to build advanced digital and software skills among Jordanian professionals. 12. Educational cooperation includes training programmes, scholarships, and technical courses, with thousands of Jordanians having graduated from Indian higher education institutions. 13. Cultural relations remain vibrant through regular exchanges in music, dance, cinema, yoga events, and participation in major cultural festivals in Jordan. 14. During the visit, leaders discussed cooperation in digital infrastructure, renewable energy, agriculture, innovation, health, tourism, and people-to-people linkages. 15. Both sides reaffirmed strong commitment against terrorism, shared regional security concerns, and emphasized peace, stability, and strategic alignment in West Asia.   MCQ:   1. The Prime Minister’s visit to Jordan mentioned in the text took place on: A. 10–11 December 2025 B. 15–16 December 2025 C. 16–17 December 2025 D. 18–19 December 20252. The bilateral discussions during the visit were held with: A. President of Jordan B. King Abdullah II C. Prime Minister of Jordan only D. Speaker of the Jordanian Parliament3. The visit is described as the Prime Minister’s: A. Second official state visit to Jordan B. First full-fledged bilateral visit to Jordan C. First visit to West Asia D. First transit visit to Jordan 4. The year 2025 marked the: A. 50th anniversary of diplomatic relations B. 60th anniversary of diplomatic relations C. 75th anniversary of diplomatic relations D. 80th anniversary of diplomatic relations 5. Diplomatic relations between the two countries are stated to be established in: A. 1947 B. 1950 C. 1960 D. 1976 6. How many MoUs were signed during the visit, as stated in the text? A. Three B. Five C. Seven D. Ten 7. Which of the following areas was covered by the signed outcomes? A. Nuclear power cooperation B. Water resource management C. Space launch partnership D. Fisheries agreement 8. The twinning initiative mentioned was between: A. Petra and Ajanta B. Petra and Ellora C. Jerash and Hampi D. Aqaba and Konark 9. India is described as Jordan’s: A. Largest trading partner B. Second largest trading partner C. Third largest trading partner D. Fourth largest trading partner 10. The proposed bilateral trade target over the next five years was: A. US$ 2 billion B. US$ 3 billion C. US$ 5 billion D. US$ 10 billion 11. Jordan is highlighted as a leading supplier to India of: A. Rare earth minerals B. Phosphates and potash fertilizers C. Crude oil and LNG D. Copper and zinc 12. Approximately how many Indian nationals are stated to live in Jordan? A. Around 7,500 B. Around 12,500 C. Around 17,500 D. Around 27,500 13. The Trade and Economic Joint Committee (TEJC) is noted as being set up under the: A. 1950 Diplomatic Agreement B. 1960 Friendship Treaty C. 1976 Trade Agreement D. 2009 Tourism Agreement 14. The India–Jordan Center of Excellence in Information Technology (IJCOEIT) was inaugurated in: A. 2018 B. 2020 C. 2021 D. 2023 15. Which one of the following was explicitly reaffirmed by both sides during the visit? A. Support for a single regional military bloc B. Commitment against terrorism in all forms C. Adoption of a common currency mechanism D. A bilateral customs union arrangement  

More Details

India–Ethiopia Strategic Partnership: Key Developments and Cooperation Areas

India–Ethiopia Strategic Partnership: Key Developments and Cooperation Areas   Key Takeaways PM Narendra Modi visited Ethiopia on 16-17 December 2025, on his first bilateral visit. He was conferred with ‘Great Honor Nishan of Ethiopia’ country’s highest honour during Addis Ababa visit. India and Ethiopia have elevated their bilateral ties to a Strategic Partnership, marking a new phase of cooperation. India, Ethiopia signed eight MoUs, agreements, including that for establishing a Data Centre at Ethiopia’s Ministry of Foreign Affairs and for debt restructuring under the G20 Common Framework. Over 675 Indian companies are registered with the Ethiopian Investment Commission, with total investments over USD 6.5 billion, especially in key sectors of manufacturing and pharmaceuticals, creating over 75,000 local jobs. Bilateral ties are supported by structured dialogues such as Foreign Office Consultations and Joint Trade Committee meetings. High-level political engagement is also sustained through Prime Minister-level meetings on the sidelines of G20 and BRICS Summits, and regular External Affairs Minister interactions. India–Ethiopia total trade stood at US$ 550.19 million in FY 2024–25. Indian exports are US$ 476.81 million and imports US$ 73.38 million, making the relationship strongly export-driven.     1. Prime Minister Narendra Modi visited Ethiopia on 16–17 December 2025 during a three-nation tour, arriving in Addis Ababa for formal talks with Abiy Ahmed. 2. He received the Great Honor Nishan of Ethiopia, the country’s highest award, in Addis Ababa, recognising contributions toward strengthening the bilateral partnership publicly, significantly. 3. Leaders elevated relations to a Strategic Partnership, signalling expanded cooperation in trade, investment, technology, skilling, education, defence, ICT, and people-to-people linkages across multiple sectors. 4. Eight agreements and MoUs were signed, including establishing a data centre at Ethiopia’s foreign ministry and formal debt restructuring under the G20 Common Framework. 5. Historical ties span over two millennia, including Axumite-era trade and exchanges via Adulis, linking Indian merchants with Ethiopian gold and ivory maritime routes early. 6. Formal diplomatic relations began in 1950, evolving into collaboration on trade, investment, capacity building, and development cooperation supported by structured institutional mechanisms today regularly. 7. High-level engagement occurs through regular meetings alongside G20 and BRICS summits, supplemented by ministerial interactions, telephonic conversations, Foreign Office Consultations, and Joint Trade Committees. 8. India–Ethiopia trade in FY 2024–25 totaled US$550.19 million, with exports US$476.81 million and imports US$73.38 million, yielding a surplus, making the relationship strongly export-driven. 9. Over 675 Indian companies are registered in Ethiopia, with investments exceeding US$6.5 billion, especially in manufacturing and pharmaceuticals, supporting substantial local employment across regions. 10. Indian investment is described as creating over 75,000 local jobs, alongside industrial capacity in essential sectors, including textiles, manufacturing, and pharmaceuticals production for Ethiopia. 11. Ethiopia benefits under India’s duty-free tariff preference for least developed countries, supporting market access and encouraging diversification and deeper economic cooperation for mutual benefit. 12. Recent exchanges included defence cooperation talks, parliamentary delegations, election-board study visit, and participation in textiles, health, solar energy, and governance programmes in Addis Ababa. 13. In 2025, a multi-party Indian parliamentary delegation met Ethiopian leaders and African Union representatives during May–June, emphasising zero tolerance toward terrorism and mutual solidarity. 14. Cooperation priorities discussed included digital public infrastructure, health security, digital health, traditional medicine, Jan Aushadhi Kendra, food security, natural farming, agri-tech, and innovation partnerships. 15. Both sides highlighted collaboration on climate action, renewable energy, disaster risk reduction, and engagement with international initiatives such as IBCA, CDRI, GBA, and ISA.         MCQ: 1. With reference to the visit mentioned, the Prime Minister’s visit to Ethiopia took place on: A. 10–11 November 2025 B. 16–17 December 2025 C. 26–27 December 2025 D. 1–2 January 2026 2. The Prime Minister arrived in Ethiopia for formal talks in: A. Addis Ababa B. Gondar C. Dire Dawa D. Mekelle 3. The Great Honor Nishan of Ethiopia, mentioned in the text, is: A. A state-level military decoration B. Ethiopia’s highest award C. An award of the African Union D. An economic merit award for investors 4. The bilateral relationship was elevated to a: A. Comprehensive Economic Partnership B. Strategic Partnership C. Defence Alliance Treaty D. Customs Union Arrangement 5. How many agreements and MoUs were signed during the visit as stated? A. Four B. Six C. Eight D. Ten 6. Which of the following was included among the signed outcomes? A. Establishing a data centre at Ethiopia’s foreign ministry B. Setting up a nuclear research facility C. Launching a single-currency trade settlement D. Establishing a joint space station programme 7. The debt restructuring mentioned was under the: A. Paris Club Mechanism B. G20 Common Framework C. IMF Extended Fund Facility D. World Bank Debt Service Suspension Initiative only 8. The text notes that historical ties span over: A. 500 years B. 1,000 years C. 2,000 years D. 3,500 years 9. The Axumite-era exchanges referenced in the text involved maritime links via: A. Massawa B. Adulis C. Berbera D. Mombasa 10. Formal diplomatic relations between the two countries began in: A. 1947 B. 1950 C. 1956 D. 1962 11. High-level engagement is described as occurring alongside: A. ASEAN and SCO summits B. G20 and BRICS summits C. SAARC and BIMSTEC summits D. Commonwealth and NAM summits only 12. India–Ethiopia trade in FY 2024–25 was approximately: A. US$150.19 million B. US$350.19 million C. US$550.19 million D. US$750.19 million 13. As per the text, India’s exports to Ethiopia in FY 2024–25 were about: A. US$176.81 million B. US$276.81 million C. US$476.81 million D. US$676.81 million 14. Over how many Indian companies are registered in Ethiopia, as stated? A. Over 275 B. Over 475 C. Over 675 D. Over 875 15. Ethiopia benefits under India’s: A. Export Credit Guarantee Scheme for developed countries B. Duty-free tariff preference for least developed countries C. Customs Union with African states D. Preferential market access only for landlocked countries

More Details

Free IAS Guidance
Start Your Journey Today 🇮🇳

Fill out the form below, and we will be in touch shortly.