Power Sector Transformation in India

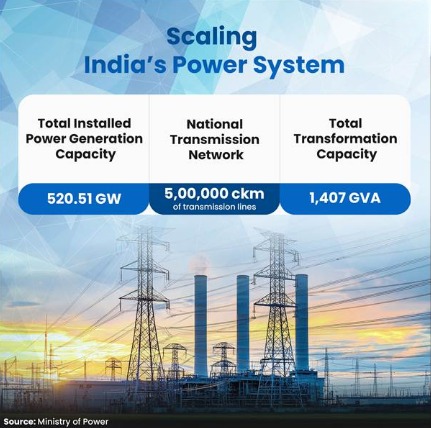
1. India’s installed power generation capacity reached 520.51 GW (Gigawatt) by January 2026, reflecting record annual additions and a broad expansion across conventional and renewable energy sources nationwide during FY26 (Financial Year 2025–26).
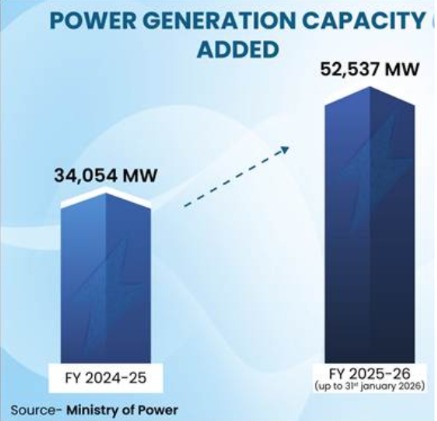
2. During 2025–26 up to 31 January 2026, India added a record 52,537 MW (Megawatt) capacity, including 39,657 MW renewable, surpassing the previous annual addition benchmark achieved in FY25 (Financial Year 2024–25).
3. Renewable additions during 2025–26 included 34,955 MW of solar power and 4,613 MW of wind power, marking the strongest single-year clean energy expansion achieved so far nationally.
4. India’s national transmission network exceeded 5 lakh circuit kilometres by January 2026, while total transformation capacity reached 1,407 GVA (Gigavolt-Ampere), strengthening nationwide grid connectivity and evacuation capability across regions.
5. Peak power demand met during FY 2025–26 reached 242.49 GW, while the national power shortage declined sharply to 0.03 percent by December 2025 from 4.2 percent earlier.
6. Major electrification programmes invested about ₹1.85 lakh crore, enabling electrification of 18,374 villages and providing electricity connections to around 2.86 crore households during the Saubhagya implementation period nationwide.

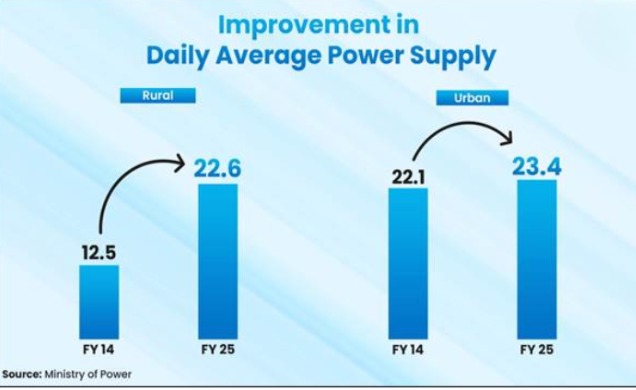
7. Average daily rural power supply improved from 12.5 hours in FY14 (Financial Year 2013–14) to 22.6 hours in FY25, while urban supply rose from 22.1 hours to 23.4 hours nationally overall.
8. Per capita electricity consumption rose to 1,460 kilowatt-hours in 2024–25, increasing by 503 kilowatt-hours from 2013–14 and showing a rise of about 52.6 percent across India.
9. The RDSS (Revamped Distribution Sector Scheme), launched in 2021, carried an outlay of about ₹3.03 lakh crore, with projects worth ₹2.8 lakh crore already approved across states nationwide significantly.
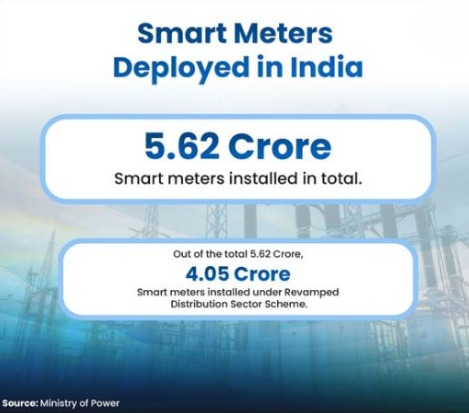
10. As of 15 January 2026, 4.05 crore smart meters had been installed under RDSS, while total smart meter installations across all initiatives reached 5.62 crore across India overall.
11. Outstanding dues in the power sector fell from ₹1.4 lakh crore in June 2022 to ₹4,109 crore by February 2026 after structured payment reforms improved discipline substantially nationwide.
12. Power distribution utilities recorded a positive profit after tax of ₹2,701 crore in FY25, reversing losses of ₹67,962 crore and indicating a major financial turnaround across India decisively.
13. Aggregate Technical and Commercial losses declined from 22.62 percent in FY14 to 15.04 percent in FY25, while the ACS–ARR (Average Cost of Supply–Average Revenue Realised) gap narrowed to ₹0.06 per unit nationally significantly.
14. India ranked fourth globally in total installed renewable energy capacity, with solar capacity rising from 3 GW in 2014 to 140 GW by January 2026 across India rapidly.
15. On 29 July 2025, renewable sources met 51.5 percent of India’s 203 GW electricity demand, with solar, wind, and hydro contributing 44.50, 29.89, and 30.29 GW nationwide together.
Must Know Terms :
1.DISCOMs (Distribution Companies): Distribution companies form the consumer-facing segment of the electricity system. They handle supply delivery, billing, complaint resolution, and revenue collection. Their financial improvement became visible when utilities together recorded a profit after tax of ₹2,701 crore in FY25. Outstanding dues fell sharply, and distribution reforms reduced losses, improved cost recovery, and strengthened payment flows across the power chain.
2. Saubhagya (Pradhan Mantri Sahaj Bijli Har Ghar Yojana): Saubhagya was a major household electrification drive focused on providing last-mile electricity connections to unelectrified homes. During its implementation period from October 2017 to March 2022, around 2.86 crore households received electricity connections. It worked alongside broader distribution strengthening efforts and helped convert electricity access from a policy target into a near-universal reality across rural and underserved regions.
3. RDSS (Revamped Distribution Sector Scheme): The Revamped Distribution Sector Scheme was launched in 2021 to improve operational efficiency and financial sustainability of distribution utilities. It carried an outlay of about ₹3.03 lakh crore, with projects worth ₹2.8 lakh crore already approved. Smart metering became one of its most important components, and by 15 January 2026, 4.05 crore smart meters had been installed under the scheme.
4. GVA (Gigavolt-Ampere): GVA refers to a unit used to measure transformation capacity in substations. It shows how much electrical load transformers can handle while converting electricity between voltage levels for transmission and distribution. India’s total transformation capacity reached 1,407 GVA by January 2026. Under the national electricity plan, this is projected to increase further to 2,345 GVA by 2032.
5. AT&C (Aggregate Technical and Commercial): Aggregate Technical and Commercial losses measure electricity lost through technical inefficiencies, theft, leakages, poor billing, and weak collection systems. This indicator shows how effectively power distribution utilities manage supply and revenue. India reduced AT&C losses from 22.62 percent in FY14 to 15.04 percent in FY25. The decline reflected stronger operations, better metering, improved billing practices, and tighter distribution discipline nationally.
6. ACS-ARR (Average Cost of Supply–Average Revenue Realised): ACS-ARR represents the gap between Average Cost of Supply and Average Revenue Realised. It shows whether distribution utilities recover enough revenue to cover supply costs. A high gap indicates financial stress, while a narrow gap suggests better viability. This gap declined sharply from ₹0.78 per unit in FY14 to ₹0.06 per unit in FY25, showing major progress in cost recovery.
Key Takeaways
a) India’s installed power capacity reached 51 GW as of January 2026, with the power shortage declining from 4.2% in FY14 to 0.03% till December 2025.
b) An investment of ₹1.85 lakh croreenabled the electrification of 18,374 villages and the connection of 86 crore households.
c) Outstanding dues reduced from ₹1.4 lakh crore (June 2022) to ₹4,109 crore (February 2026), while DISCOMs recorded a ₹2,701 crore profit in FY25.
d) The rollout of smart metering is preparing the power sector for a more digital, transparent, and participatory future.
MCQ :
1. India’s installed power generation capacity as of January 2026 stood at:
A) 480.51 GW
B) 520.51 GW
C) 540.15 GW
D) 502.15 GW
2. During 2025–26 up to 31 January 2026, India added a record generation capacity of:
A) 52,537 MW
B) 39,657 MW
C) 34,955 MW
D) 54,613 MW
3. Out of the total capacity added during 2025–26 up to 31 January 2026, renewable energy accounted for:
A) 34,955 MW
B) 52,537 MW
C) 39,657 MW
D) 4,613 MW
4. India’s national transmission network exceeded which milestone by January 2026?
A) 4 lakh circuit kilometres
B) 5 lakh circuit kilometres
C) 6 lakh circuit kilometres
D) 7 lakh circuit kilometres
5. Total transformation capacity in India by January 2026 reached:
A) 1,207 GVA
B) 1,307 GVA
C) 1,507 GVA
D) 1,407 GVA
6. Peak power demand successfully met during FY 2025–26 was:
A) 232.49 GW
B) 252.49 GW
C) 242.49 GW
D) 222.49 GW
7. The national power shortage declined to what level by December 2025?
A) 0.03 percent
B) 0.30 percent
C) 0.3 percent
D) 0.13 percent
8. Major electrification programmes enabled electricity connections to around:
A) 1.86 crore households
B) 3.26 crore households
C) 2.86 crore households
D) 2.06 crore households
9. Average daily rural power supply increased to how many hours in FY25?
A) 22.6 hours
B) 21.6 hours
C) 23.6 hours
D) 20.6 hours
10. Per capita electricity consumption in 2024–25 rose to:
A) 1,260 kilowatt-hours
B) 1,460 kilowatt-hours
C) 1,560 kilowatt-hours
D) 1,360 kilowatt-hours
11. The Revamped Distribution Sector Scheme was launched in:
A) 2019
B) 2020
C) 2022
D) 2021
12. As of 15 January 2026, smart meters installed under RDSS stood at:
A) 5.62 crore
B) 4.05 crore
C) 3.05 crore
D) 4.50 crore
13. Outstanding dues in the power sector declined to what amount by February 2026?
A) ₹4,109 crore
B) ₹14,109 crore
C) ₹1.4 lakh crore
D) ₹2,701 crore
14. Power distribution utilities recorded what profit after tax in FY25?
A) ₹2,071 crore
B) ₹2,170 crore
C) ₹2,701 crore
D) ₹2,107 crore
15. India ranked which position globally in total installed renewable energy capacity?
A) Third
B) Fifth
C) Fourth
D) Sixth


0 comment